Videocentric
I&I Detection
A high-speed solution
for pinpointing I&I
Videocentric I&I Detection
Locating faulty underground wastewater infrastructure has always been a daunting task. Finally, that is all about to change. iTracking®, along with its groundbreaking Computer Generated Imagery technology (Playback™), is poised to transition the complexities of Inflow and Infiltration (I&I) detection from a difficult and expensive process to one that is simple and inexpensive.
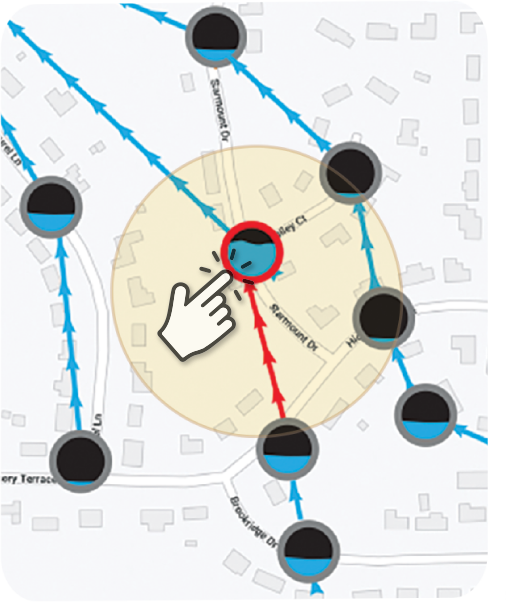
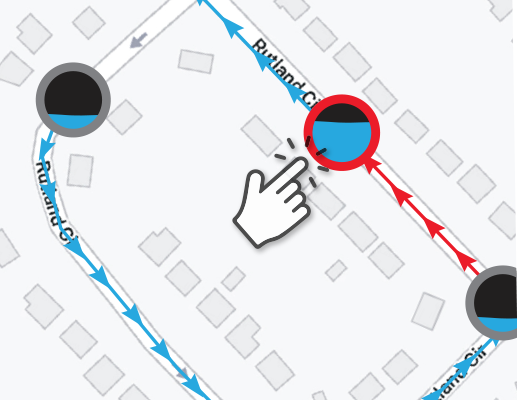
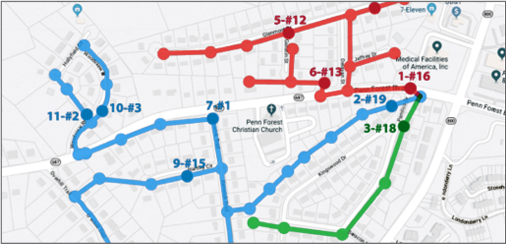
With a click of the Playback™ button, users are immediately presented with an animated video showing the relationship between wastewater levels and weather events leading up to the I&I episode in question. Specifically developed algorithms quickly isolate and determine those sites responsible for the highest volumes of I&I. Each problematic site is then encircled with a “red ring” for quick identification. I&I is isolated to within adjacent monitored sites.
4 Individual Technologies
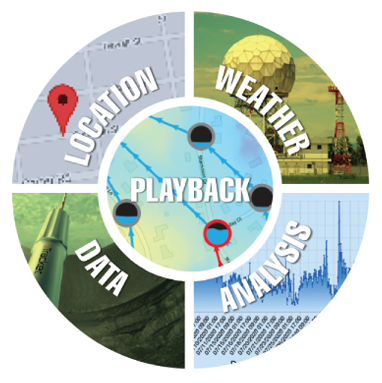
Every I&I detection study requires costly and time-consuming integration of four independently derived factors; geographic location, historical weather, sensor data and mathematical analysis.
1 User-Friendly Solution
Utilizing CGI (Computer Generated Imagery) technology, Playback™ efficiently integrates all four factors; location, weather, data and analysis, into a user-friendly, easy to understand animated video experience.
It starts with a Smart Sensor™
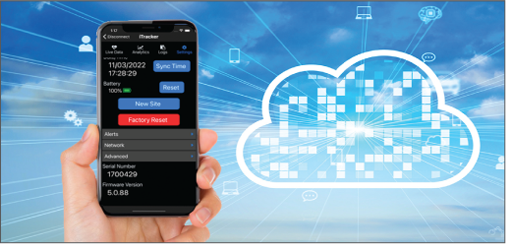
iTracker smart I&I Detection sensors are packed with powerful features that give you the ability to monitor, analyze and alert on a single platform. Designed with both Bluetooth and cellular capability, sensors can be deployed in just 20 minutes, do not require confined space entry and are maintenance-free.
- Non-Contact | Lightweight: 1.9lbs | Bluetooth & Cellular Enabled
- 12 Month Battery Life | (2) - 3.6v Lithium D Cell | Onboard Data Logger
High Resolution Intelligence
iTracker Smart Sensors deliver a network of high resolution data points that quickly pinpoint I&I down to a set of adjoining manholes.
User-Friendly
20 Minute Setup
iTracker sensors can be installed in just 20 minutes without confined space entry.
5 Minute Data Retrieval
iTracker sensors allow for effortless setup and retrieval of data through either Bluetooth or cellular connectivity.
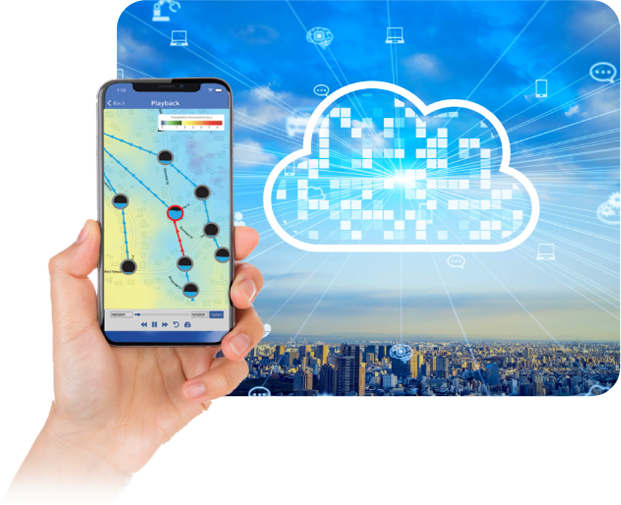
Cloud Connectivity Makes it Simple
Our cloud connectivity allows you to instantly access actionable reports and on-demand animated videos from any location.
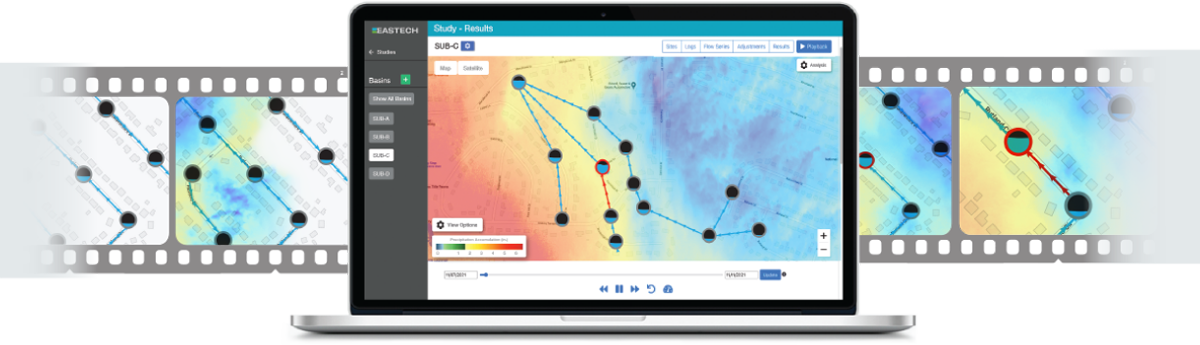
Playback™: I&I Detection at a Glance
Playback™ visually integrates location, weather, data and analysis into one simple to understand video
Stop Wondering... Start Watching
With iTracking’s unique Playback™ feature, the I&I discovery process becomes as simple as watching an animated video of the performance of your collection network under both normal and adverse weather conditions. Users are able to view, either in historical or real-time mode, wastewater volumes rising or receding in relation to storm intensity and follow along as dynamic visuals provide a moving timeline of I&I contribution for each monitored location.
Updated every 5 minutes, sites responsible for the greatest increases of I&I are automatically indicated by highly visible red rings. By clicking on these sites, performance related graphs, charts and reports detailing the extent of I&I in GPM are automatically generated.
Precision Results
With Playback™, hours and days of animated video showing collection system performance can be compressed into just seconds of viewing time. At each monitored site, historical weather data, updated once every 5-minutes, is synced with 5, 10 or 15-minute interval flow data ultimately providing users with a clearly presented visualization of exactly what had transpired within the collection network during the I&I study period.
- See RDII effects relating to all monitored sites.
- Automatic designation (red ring) of sites exhibiting high volumes of I&I.
- Isolated analysis of monitored pipe segments.
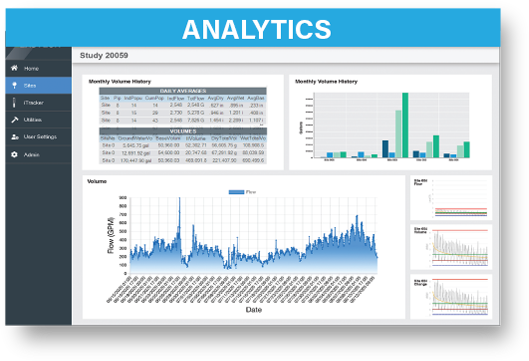
- Automatic I&I analysis and generation of graphs and reports in GPM.
Automatic Analysis & Reports
Data from each monitored site is automatically analyzed, interpreted and displayed giving users the power to track I&I down to a pair of adjacent manholes. Eastech’s AutoAnalysis and AutoReporting features make it easy for municipal and utility personnel to quickly obtain final study results without the need for tedious and time-consuming manual data interpretation.
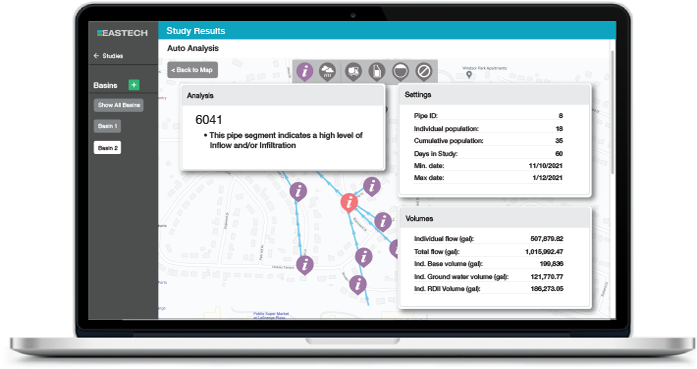
The 80/20 Rule Applies
It has been proven over and over again by hundreds of studies dedicated to the detection of I&I that 80% of I&I resides in just 20% of the collection piping. This is why it is so important to select an I&I Detection System that has the ability to locate the 20% down to a set of adjacent manholes. It is here that iTracking™ with Playback™ differentiates itself from its competition. Every monitored pipe segment within the iTracking System has the analytical capability for generating individual graphs and reports in GPM relating specifically to the isolated segment selected for evaluation.
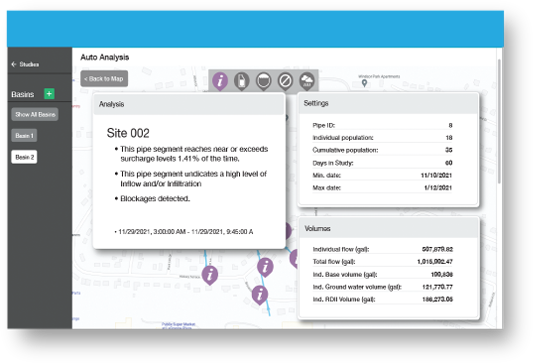
Clicking on any individual site automatically provides:
Auto-Analytical Reports detailing the extent of I&I in GPM for each individually isolated pipe segment.
Flow Graphs for each individually isolated pipe segment.
Hydrographs for each individually isolated pipe segment.
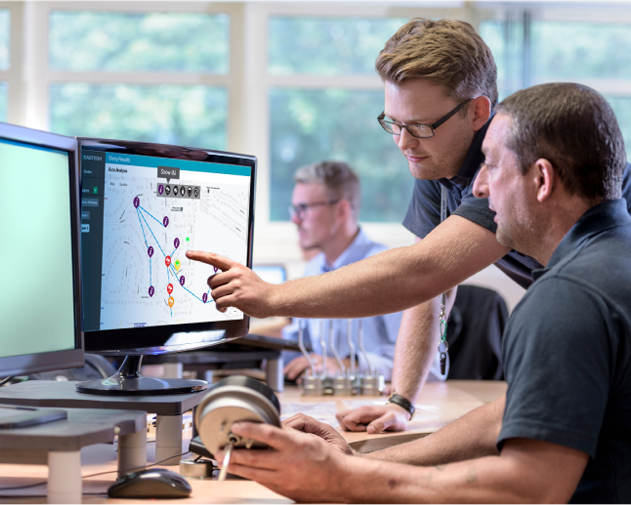
Customer Support Program
Determination of
iTracker® Placement
Prior to your placing an order, Eastech will assign a Project Manager to your account who will review a map of the areas selected for I&I investigation and recommend quantity and placement of iTracker® sensors.
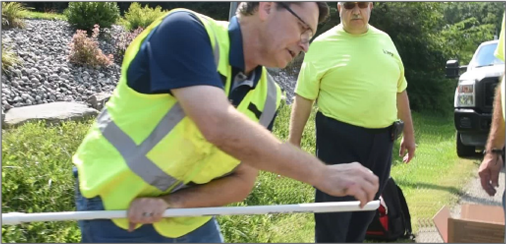
On-Site Installation
Supervision & Training
After order placement, a Project Manager will coordinate a mutually agreeable time to visit the site to supervise installation of iTracker® sensors and train field personnel in the operation of the iTracking® hardware.
Data Retrieval and
Upload Assistance
Collection of data can be accomplished through on-site Bluetooth connectivity or by direct upload to the Eastech Cloud via Cellular means. One of our Project Managers will be available online to assist.
Review of Results,
Reports and Videos
Upon completion of uploading data to the Eastech Cloud, iTracking’s auto-analytical software will present animated videos, reports and graphs that can then be reviewed and discussed with the Project Manager.