24/7 Condition Assessment
Automatically track and detect underperforming areas of the collection network with iTracking’s powerful AutoAnalysis™ and AutoReporting™ capabilities
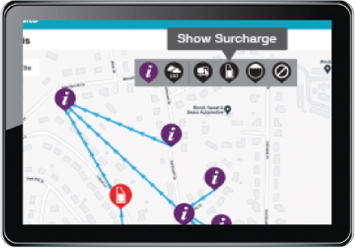
Round-the-Clock Situational Awareness
iTracking's cloud-based AutoAnalytics™, in addition to pinpointing major areas of I&I, automatically recognizes and alerts utility personnel to impending problematic situations occurring within the wastewater collection grid. Color-coded icons, depending upon the severity of the situation, are prominently displayed for ease of identification. To understand exactly what transpired within each site, with the simple click of a button, animated videos display events leading up to each situational alert.
I&I
Cleaning
Surcharge
Capacity
Blockages
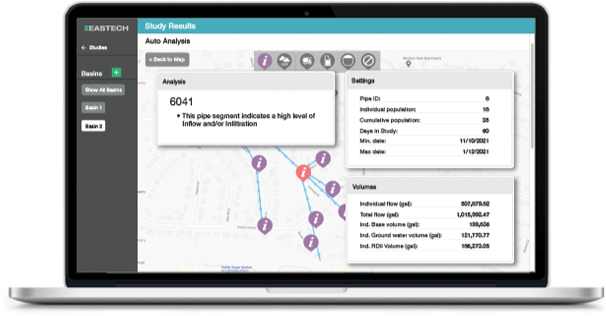
Automatic Analysis and Reporting
With iTracking's cloud-based AutoAnalysis™ feature, data from each monitored site is automatically analyzed and visually presented and reported upon without the need for tedious and time-consuming manual interpretation of data. Along with iTracking’s AutoReports™ feature, users can click on any highlighted icon designating a problem and detailed PDF printable reports are automatically generated for each problematic location, AutoReports™ quickly describe collection system performance while bringing to the forefront operational problems related to blockages, capacity, surcharge events, and the need for unscheduled cleaning… thereby making iTracking a fully comprehensive system for 24/7 collection system assessment.
Video Playback™


Through a totally unique feature called Playback™, understanding what transpired during an unexpected situation becomes as simple as watching an animated video of the changes in collection system performance between normal and abnormal conditions. With a few clicks of a button, O&M personnel can view either in historical or real-time mode, changes in collection system conditions prior to, during and after an alert has been initiated.
Dynamic visuals provide a moving timeline of performance for each monitored location. Updated every 5 minutes, sites responsible for erratic behavior are immediately brought to attention through the availability of simple to understand animated videos.
Within minutes of watching Playback, operating and engineering personnel are armed with the ability to visually determine the factors responsible for each alarmed event.