The First Do-It-Yourself Solution
for Micro-Detecting I&I
I&I Micro Detection
in 2 Simple "DIY" Steps
After receiving multiple requests from small and mid-size municipalities for a simple and cost-effective "DIY" I&I Detection system, we are pleased to offer Tracpac 7.
The TracPac 7 is a packaged I&I Micro Detection system designed to quickly pinpoint areas of I&I to between a few manholes. Provided with (7) iTracker® smart sensors, accompanying hardware and auto-analytical software, the TracPac 7, in two simple steps, will accurately locate major areas of I&I after just a single rain event.
Provided with (7) iTracker® smart sensors, accompanying hardware and AI-Powered software. All for under $20K.
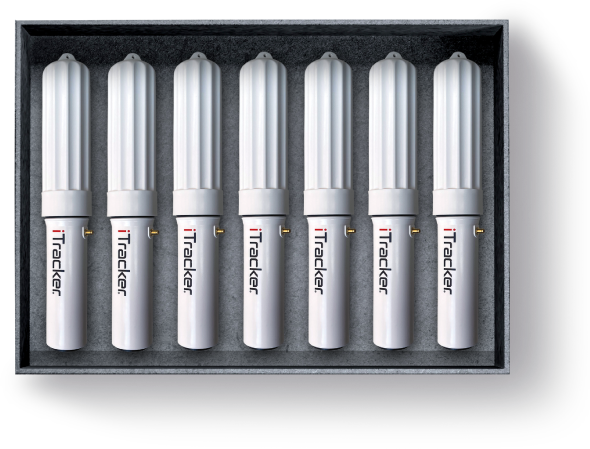
It starts with a Smart Sensor™
iTracker smart I&I Detection sensors are packed with powerful features that give you the ability to monitor, analyze and alert on a single platform. Designed with both Bluetooth and cellular capability, sensors can be deployed in just 20 minutes, do not require confined space entry and are maintenance-free.
- Non-Contact | Lightweight: 1.9lbs | Bluetooth & Cellular Enabled
- 12 Month Battery Life | (2) - 3.6v Lithium D Cell | Onboard Data Logger
High Resolution Intelligence
iTracker Smart Sensors deliver a network of high resolution data points that quickly pinpoint I&I down to between a few manholes.
User-Friendly
20 Minute Setup
iTracker sensors can be installed in just 20 minutes without confined space entry.
5 Minute Data Retrieval
iTracker sensors allow for effortless setup and retrieval of data through either Bluetooth or cellular connectivity.
Cloud Connectivity Makes it Simple
Our cloud connectivity allows you to instantly access actionable reports and on-demand animated videos from any location.


AI-Powered Video Animation
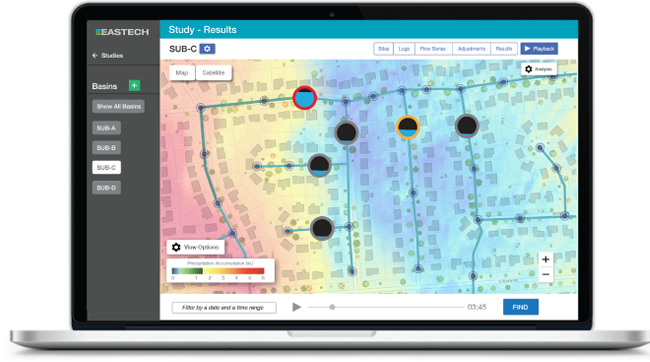
Playback™ visually integrates location, weather, data and analysis into one simple to understand video
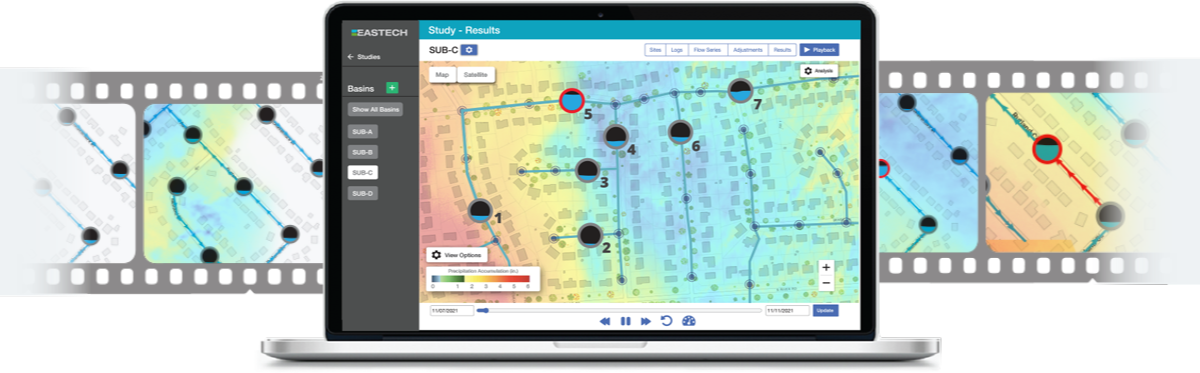
Just click the FIND button
Locating faulty underground wastewater infrastructure has always been a daunting task. Finally, that is all about to change. TracPac 7, along with its ground-breaking AI-Powered Computer Generated Imagery technology (Playback™), is poised to transition the complexities of Inflow and Infiltration (I&I) detection from a diffcult and costly process to one that is simple and inexpensive.
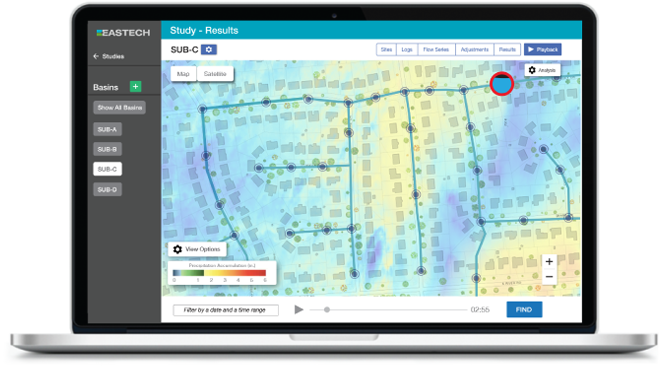
With a click of the PlaybackTM button, users are instantly presented with an animated video showing the relationship between wastewater flows and weather events leading up to the I&I episode in question. Specifically developed AI-Powered algorithms quickly isolate and determine those sites responsible for the greatest volumes of I&I. The top I&I event at each problematic site is automatically displayed and encircled with a color coded ring for immediate identification. I&I is quickly isolated to between a a few manholes.

Instead of going through the time and expense of utilizing maintenance-prone flowmeters to ascertain increases in wastewater volume during wet weather events, simply use iTracking's TracPac 7 with AI-Powered Analytics and Computer-Generated Imagery to locate with just one click of a button each Major Basin or Basins responsible for excessive contributions of I&I.
Quickly Evaluating the Extent of the Problem
By utilizing just one of the smart TracPac 7 sensors in a specific Major Basin of the collection network and then uploading the resulting data to the Eastech Cloud, iTracking® analytics will automatically generate animated videos (Playback™), Volumetric Change in Flow Graphs and EPA-Guided graphical interpretations detailing the severity of I&I within the area selected for initial investigation.
Select
It is suggested that a single iTracker sensor be installed at the base of the Major Basin study area to quickly confirm the volumes of I&I prior to conducting a "Branch" investigation.
Install
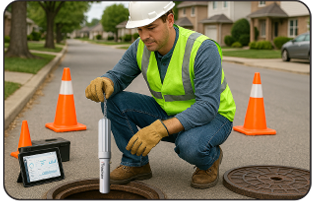
iTracker smart sensor installation is accomplished in 20 minutes without the requirement for confined space entry.
Upload

After one or two rain events, upload the collected data directly to the Eastech Cloud.
Playback Video Analysis
With TracPac 7's unique Playback™ feature, the I&I discovery process becomes as simple as watching an animated video of the performance of your collection network under both normal and adverse weather conditions. Simply by clicking the "FIND" button, users can view in historical real-time mode wastewater volumes rising or receding in relation to storm intensity and follow along as dynamic visuals provide a moving timeline of I&I contributions for each Major Basin or Basins.
By combining location, weather and performance data, the top I&I event for each Major Basin is automatically presented in an animated video format with color-coded rings (yellow, orange, red) depicting the severity of the episode.
Just click the FIND button
EPA-Guided Results
TracPac 7 uses the EPA's I&I Guidance recommendations (Wet Weather Flows exceeding 4.5 times the 60 GPD per person average daily flow) as the primary benchmark for identifying each major and micro basin within the wastewater collection network responsible for contributing excessive volumes of I&I.
A Red Diamond highlights each RDII event exceeding the "4.5 times increase" EPA benchmark.

Locate which Branches are Responsible for I&I
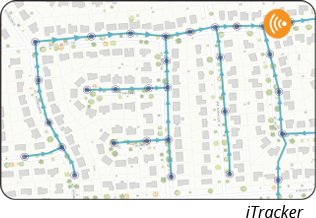
If a Major Basin selected for investigation proves out to be a substantial contributor of I&I, position TracPac 7 sensors at the base of each independent Branch making up the Major Basin (shown at right).
It has been proven over thousands of I&I Studies that 80% of I&I resides in just 20% of the collection network. By placing TracPac 7 sensors at the base of each independent Branch, the 20% of the system contributing 80% of the I&I can usually be discovered after just a single major rain event.
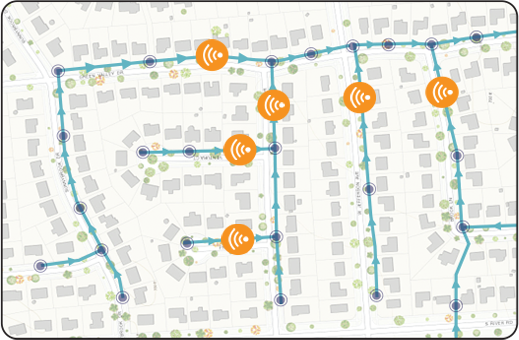
Playback shows you a moving timeline of I&I contributions for each independent branch
Users can view in historical real-time mode wastewater volumes rising or receding in relation to storm intensity and follow along as dynamic visuals provide a moving timeline of I&I contributions for each monitored location.
By combining location, weather and performance data, the top I&I event for each Branch is automatically presented in an animated video format with color-coded rings (yellow, orange, red) depicting the severity of the episode.
Once the Branches responsible for the majority of I&I are located, a further investigation can be initiated that employs either smoke testing, CCTV or additional TracPac 7 sensors to pinpoint the cause of the problem to between a set of manholes within each Branch.
Just click the FIND button
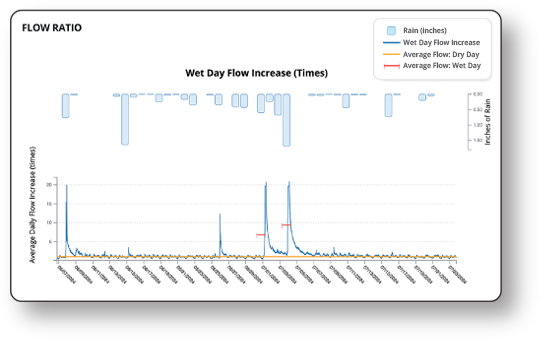
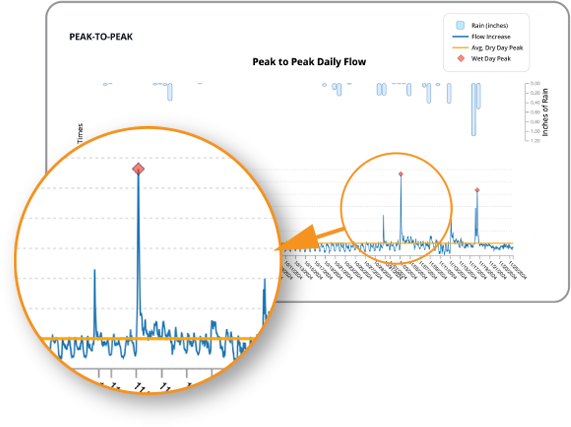
PEAK TO PEAK HYDROGRAPH
Compares the hourly wet day increase in peak flow "X times" to the average dry day peak flow. Events with excessive I&I are highlighted by a red diamond marker.
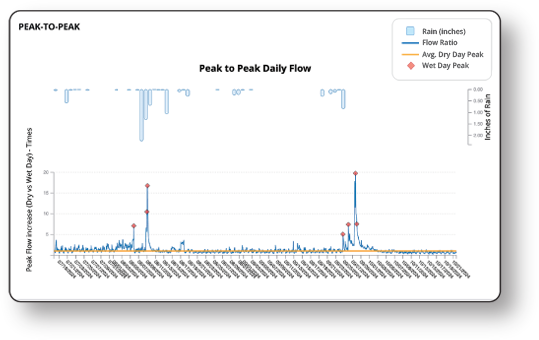
I&I SEVERITY HYDROGRAPH
Marks each day where the total daily flows reach
or exceed 4.5 times the normal dry day flows
(EPA Guidance).