GUARANTEED RESULTS!
PRECISE I&I DETECTION OR MONEY REFUNDED
High resolution smart iTracker® sensor placement is guaranteed to provide precise detection of I&I to between every 3 to 4 manholes and many times after a single rain event. If iTracking® does not perform as promised, your money is refunded.
STUDY COMPLETED REGARDLESS OF TIME
iTracking studies are guaranteed to be completed regardless of the time required. Since successful studies can sometimes take anywhere from a few weeks to "until it rains", our guarantee totally eliminates that concern.
Pinpointing I&I to within 3-4 Manholes
iTracker sensors are strategically employed throughout the collection system (7 sensors/mile) creating an intelligent series of independent micro- basins every 3-4 manholes. With iTracking's patented ability to isolate flows within each micro-basin from the micro- basin immediately preceding it, the 80% of I&I residing within 20% of the conveyance system is quickly detected…many times after just a single rain event.
This is what iTracking Services is all about. Whether it rains on the first day of the Study or it takes 9 months for the Rain Derived I&I to appear, iTracker sensors monitor the collection network on a 24/7 basis and are not removed until the greatest contributors of I&I are discovered to within micro-basins consisting of just 3-4 manholes.
Pinpointing Your I&I Has Never Been Easier!
- Round-the clock collection system performance analysis
- Advanced algorithms isolate I&I within each micro-basin from the one directly above it
- I&I pinpointed after a single major rain event
- Location, weather, data, and I&I presented in "instantly understood" animated videos
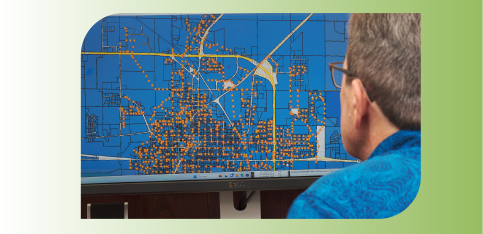
Pre-I&I Study Analysis
Prior to placement of an order, at no cost to the client, a Project Manager will be assigned to your account to review a map of the area selected for I& investigation, recommend placement of iTracker® sensors and provide a detailed cost estimate for the proposed study.
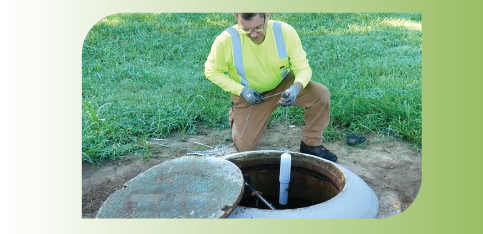
iTracker® Sensor Installation
Immediately following order placement, a Project Manager will coordinate a mutually agreeable time for our field techs to arrive at the site to begin the iTracker® smart sensor installation process plus familiarize local utility personnel with the basics of the iTracking® hardware and methodology.
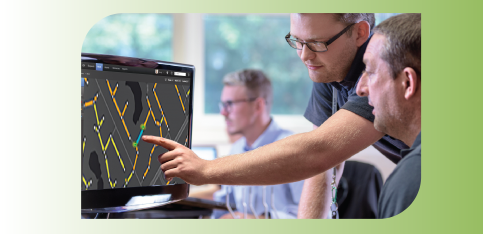
Delivery of Study Results
Upon completion of the I&I Detection Study, your assigned Project Manager will set up an initial meeting to fully review each deliverable relating to the results of the investigation. Deliverables (to remain in the possession of the customer) will include animated videos, scattergraphs, hydrographs and visualization tools including bar, pie, and level charts.
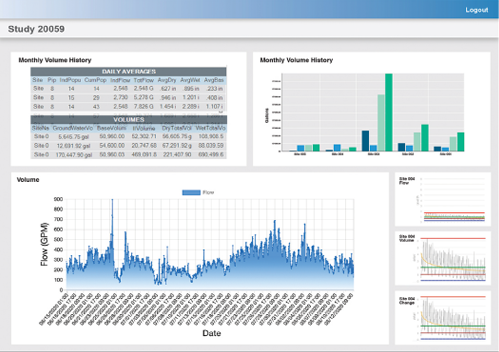
Data Visualization Reports Support the Conclusions
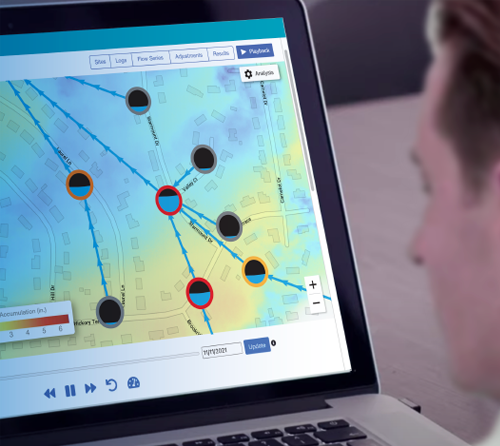
Watch I&I Develop Right Before Your Eyes
Through a totally unique feature called Playback™, the I&I discovery process becomes as simple as watching an animated video of changes in collection system performance between normal and adverse weather conditions. On-demand, users can watch animated videos showing collection system volumes increasing in direct relation to storm intensity.
Updated every 5 minutes, sites responsible for the greatest increases of I&I are immediately brought to viewers attention by highly visible red rings. Within minutes of watching PlaybackTM, utility personnel are armed with the ability to visually determine the effects and volume of I&I generated at each monitored site within their collection network.
Hydrographs & Bar Charts
Data visualization hydrographs and bar graphs not only support Playback™ videos but also detail exactly what is transpiring within the collection network on a 5, 10 or 15-minute incremental basis. Developed for each set of micro-basins under investigation, individual hydrographs along with stacked hydrographs instantly highlight which sites are responsible for the greatest influx of I&I. highly visualized bar charts showing Base flows, Groundwater Infiltration, RDII flows and Peak RDII flows provide a quick and complete understanding of collection system performance.